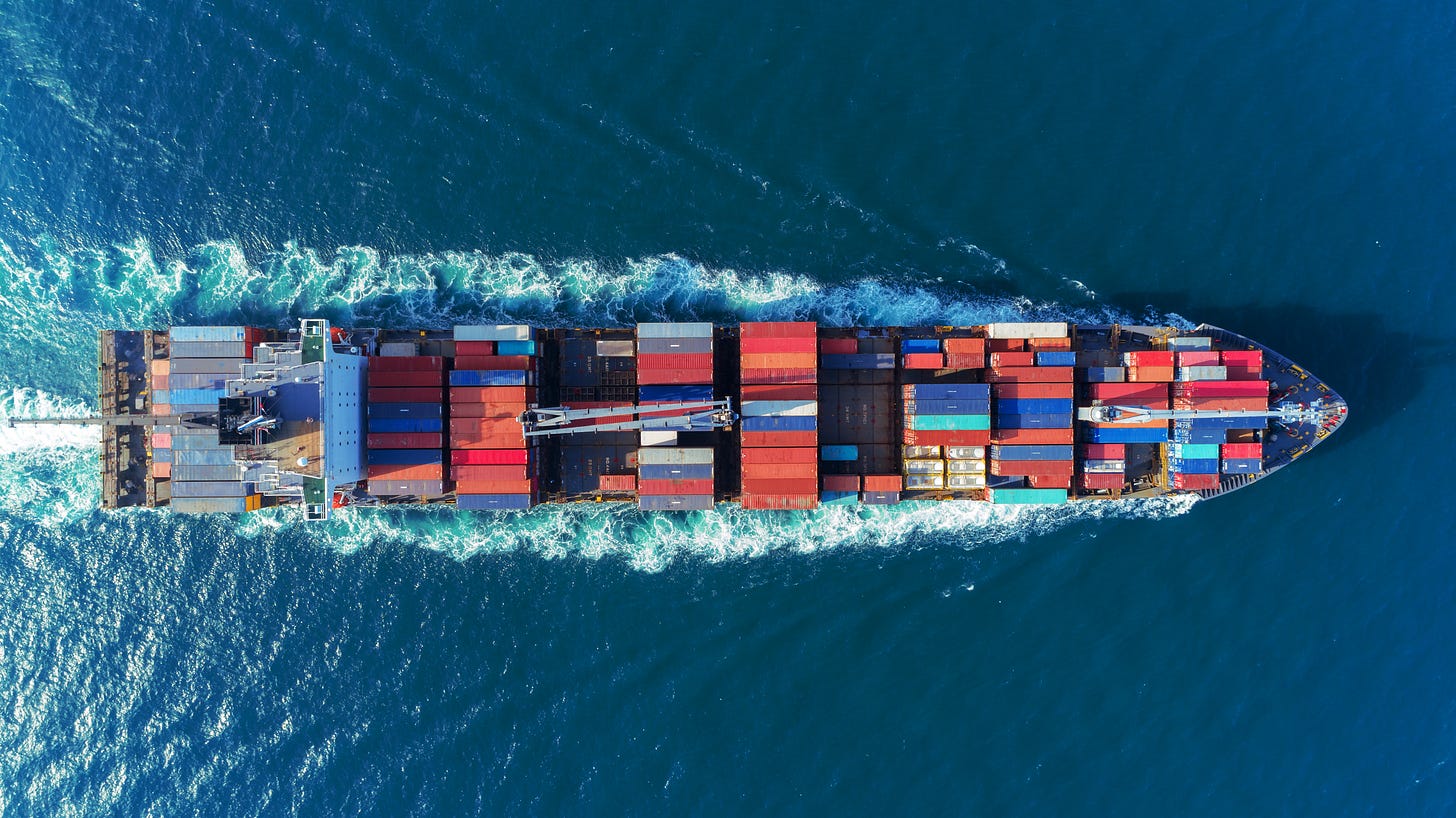
The Workhorse of Globalization: The Container Ship
Over its lifetime, the container ship travels the equivalent of nearly ten times to the moon and back. A few charts that explore the ships and ports that fuel trade and consumerist globalization.
“Buy Now.”
If there’s a phrase that encapsulates our e-commerce, consumerist world of globalization, it’s that simple exhortation. Buy Now. With a tap of the screen, a click of a mouse, a flick of the wrist, that item tempting you with purchase on your laptop or phone can be yours within a week, a day, even a few hours.
From patio furniture made in Vietnam to sneakers made in China to fast fashion items produced in Turkey or Bangladesh to cut flowers from Kenya to coffee or produce from South America, we truly live in a dizzyingly global marketplace.
What makes all of this possible is the quiet workhorse of globalization: the liner ship, most likely a container ship. After all, some 80% of all traded goods travel by sea. In a world of $19 trillion of trade, that’s millions of containers a year aboard thousands of ships quietly slipping into ports from Los Angeles to London, from Santiago to Singapore.
That new tie or the new smoothie blender you just purchased likely began its journey in the berth of a large container, stacked on a mega-ship, and exported most likely from somewhere in East Asia to a massive hub port near you, and then off-loaded onto a smaller ship or trucks or trains for their final journey to a warehouse, awaiting your click.
By the time you have received your item, that workhorse of globalization - the container ship - is likely back on the waters. According to the World Shipping Council, there are some 6,000 container ships operating worldwide. Each ship has enough capacity to carry several warehouses worth of goods. Or to put it another way, according to the World Shipping Council: “If all the containers from an 11,000 TEU ship were loaded onto a train, it would need to be 44 miles or 77 kilometers long.”
The invention of the container - now an ubiquitous symbol of globalization - surely ranks as one of the defining moments of our modern global economy. Marc Levinson, author of the definitive book on the history of container shipping, The Box: How the Shipping Container Made the World Smaller and the World Economy Bigger , writes:
“What is it about the container that is so important? Surely not the thing itself. A soulless aluminum or steel box held together with welds and rivets, with a wooden floor and two enormous doors at one end, the standard container has all the romance of a tin can.”
“The value of this utilitarian object lies not in what it is, but in how it is used. The container is at the core of a highly automated system for moving goods from anywhere to anywhere, with a minimum of cost and complication. The container made shipping cheap and changed the shape of the world economy.”
“In 1956, the year the container was introduced, the world was full of small manufacturers selling locally. By the end of the 20th century, purely local markets for goods of any sort were few and far between.”
In essence, the container and the massive ships that transport them created our global economy. And these container ships are truly the workhorses of globalization. Consider this: “In an average year a large container ship travels three-quarters of the distance to the moon,” The Shipping Council notes. Put another way, the average container ship in its lifetime will travel the equivalent of the moon and back nearly ten times.
They are also ruthlessly efficient. As the World Shipping Council notes, “the cost to transport a bicycle from Thailand to the UK in a container is about US$10. The typical cost for shipping a DVD/CD player from Asia to Europe or the U.S. is roughly US$1.50; a kilogram of coffee just fifteen cents, and a can of beer - a penny.”
This week, I thought we’d dive into some of the key players in this often unseen world of globalization, from the major shipping liners to the key global ports. A modest compilation of some interesting charts that tell the story.
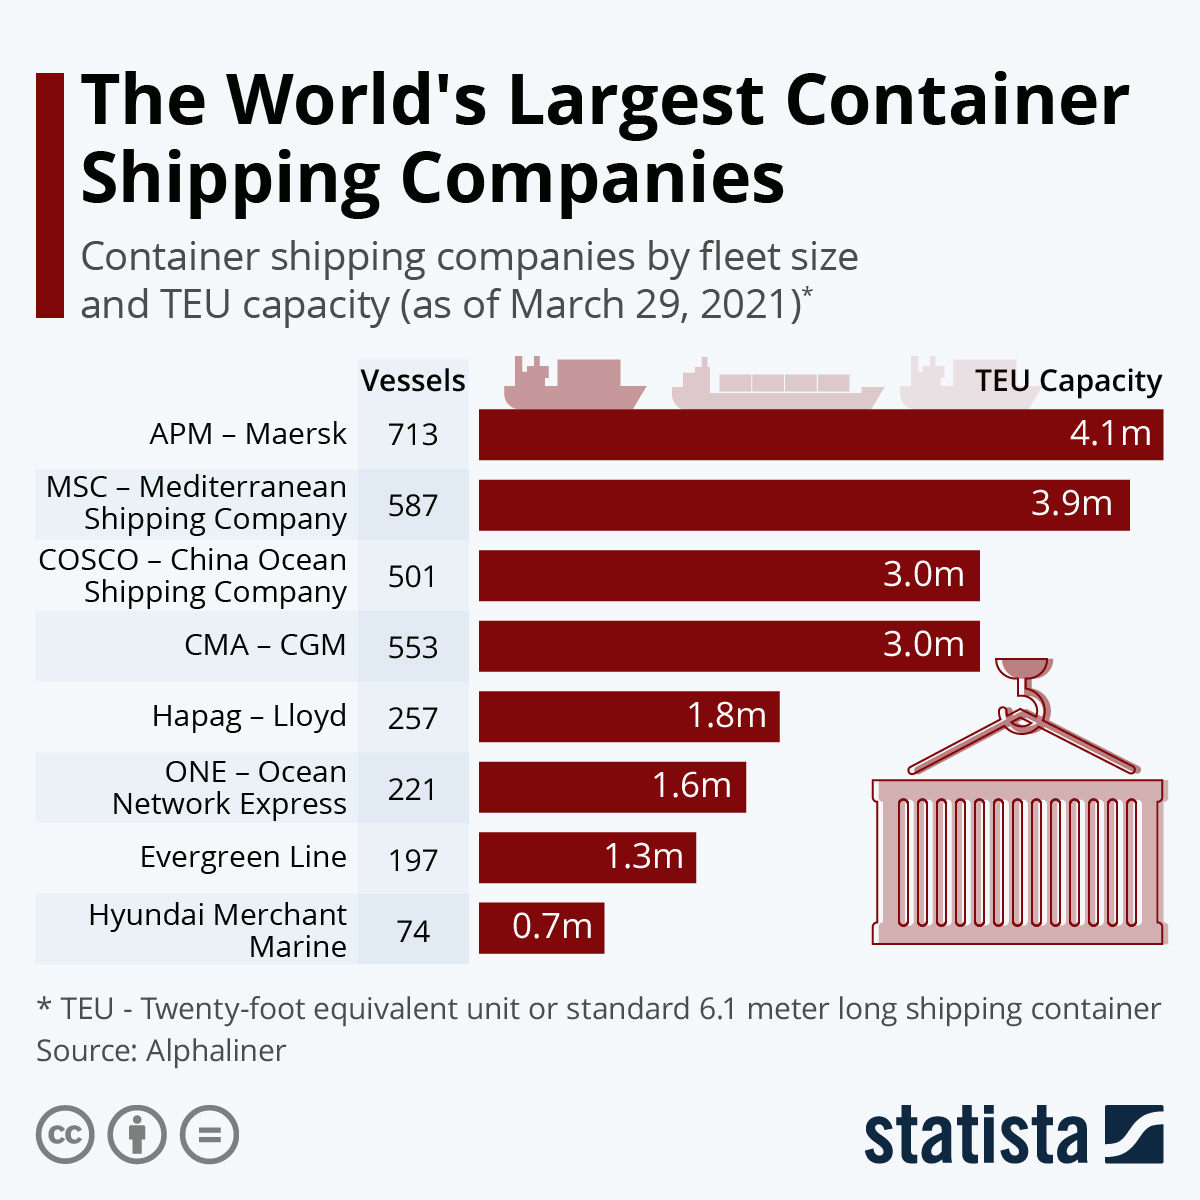
First, let’s take a look at the world’s largest container shipping companies below:
The Copenhagen-based AP Moller Maersk has held the title of largest shipping company worldwide for more than a quarter century. Operating in 130 countries and employing more than 80,000 people, the company was founded in 1904 and is still owned by the family founders of the firm, though it is also publicly-traded.
The vast majority of world trade travels on ships owned by these nine massive shipping companies. Though they are global, it’s also worth noting their home bases. They are the following:
AP Maersk - Copenhagen, Denmark
MSC - Geneva, Switzerland
COSCO - Beijing, China
CMA-CGM - Marseilles, France
Hapag - Lloyd - Hamburg, Germany
ONE - Tokyo, Japan
Evergreen Line - Taipei, Taiwan
Hyundai Merchant Marine - Seoul, South Korea
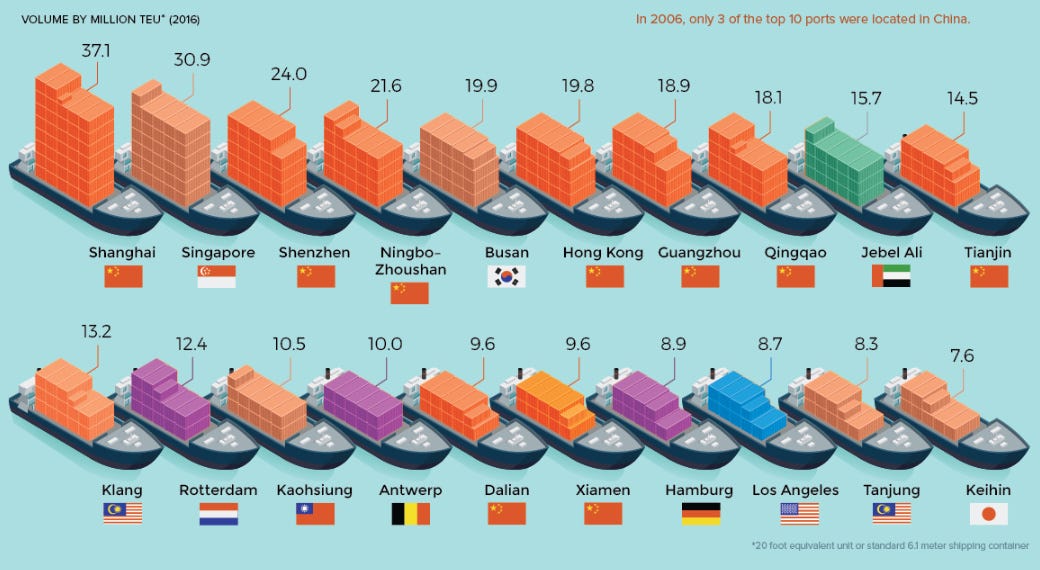
These ships make regular stops at the world’s largest sea ports. Visual Capitalist has a great info graphic from 2016 that shows the rising power of Asian ports. The chart below shows the top ten busiest ports from 2006 (on the bottom) and the top ten from 2016 at the top. Not a single top ten port from 2006 made the 2016 list. Today’s numbers largely correspond with the 2016 numbers, only cementing the rise of Asian ports (including the West Asian port of Jebel Ali in Dubai), and the retreat (relatively) of European ones.
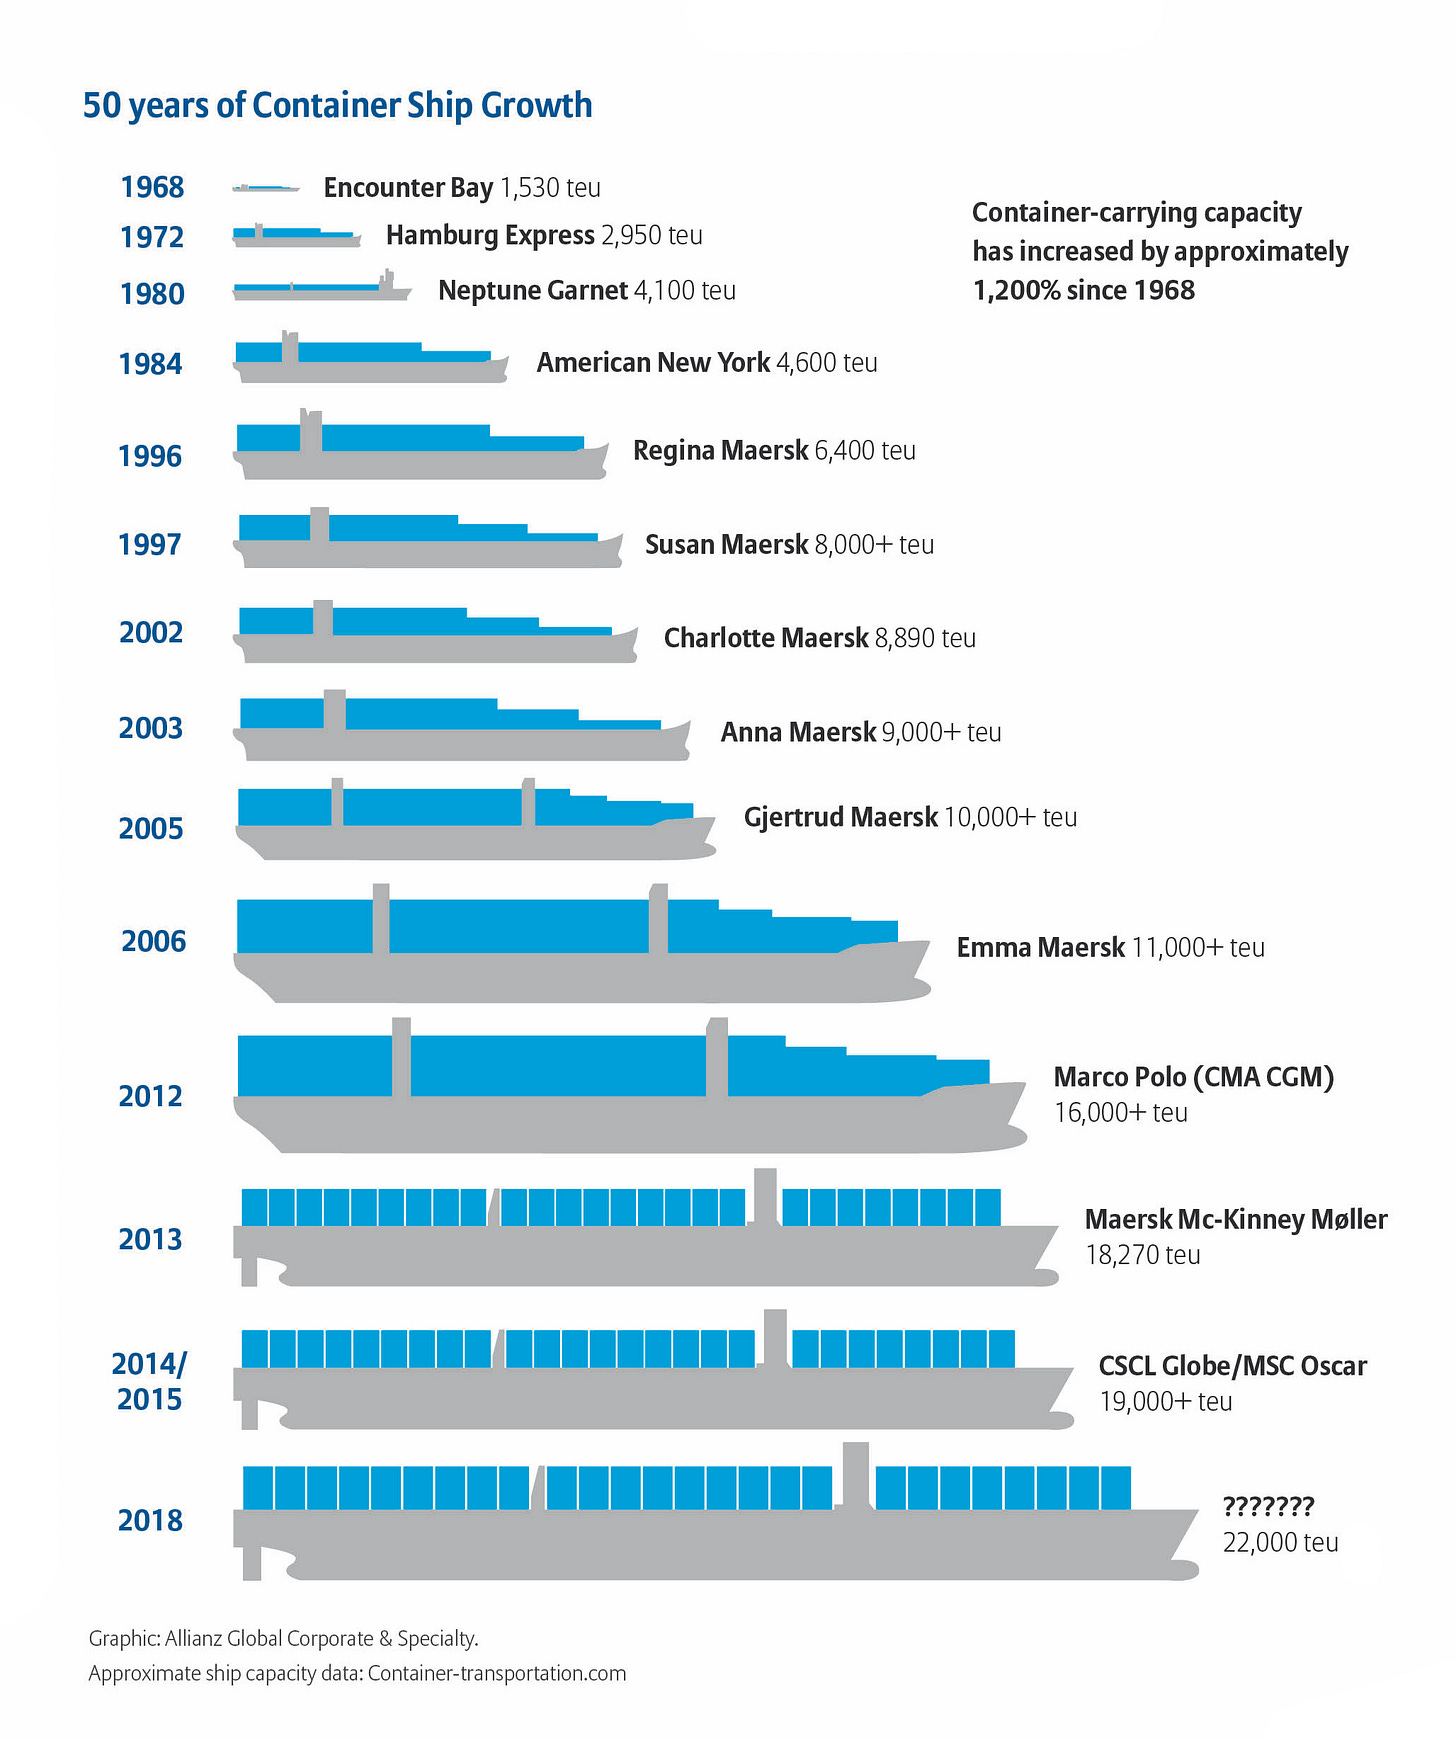
These major ports all have one thing in common: size. They need to be large to handle the increasingly massive container ships plying our oceans. Here’s a neat chart from Allianz Global that visually demonstrates the massive growth in size of the world’s container ships over five decades.
When you talk container shipping, you’ll see a lot of references to TEUs. Over at GEFCO.net, they have a handy definition. “TEU ("Twenty-foot Equivalent Unit") is defined as the approximate unit of measure of a container. This unit of measure is based on the dimensions of a standard container – height 8.5 feet (2.591m), width 8 feet (2.438m) and length 20 feet (6.096m) which represents an approximate volume of 38.5 cubic meters.”
“The TEU is a unit which is used to calculate the volume of containers loaded onto a ship or stored at a terminal. The TEU also serves to calculate the loading capacity of a container ship. Container ship operators also use the TEU to formulate their transport capacity. Port traffic is also given in TEU.”
According to the World Bank, some 795 million TEUs were transported worldwide. According to my calculations, about 1/3 of those TEUs flowed through the top ten busiest ports noted above, from Shanghai to Dubai. I recently visited Jebel Ali Port in Dubai and had visited Hong Kong port a few years ago. When you gaze out across the horizon at the stacks of containers as far as the eye can see, you get a sort of globalization vertigo. You can almost see the global economy spinning before you.
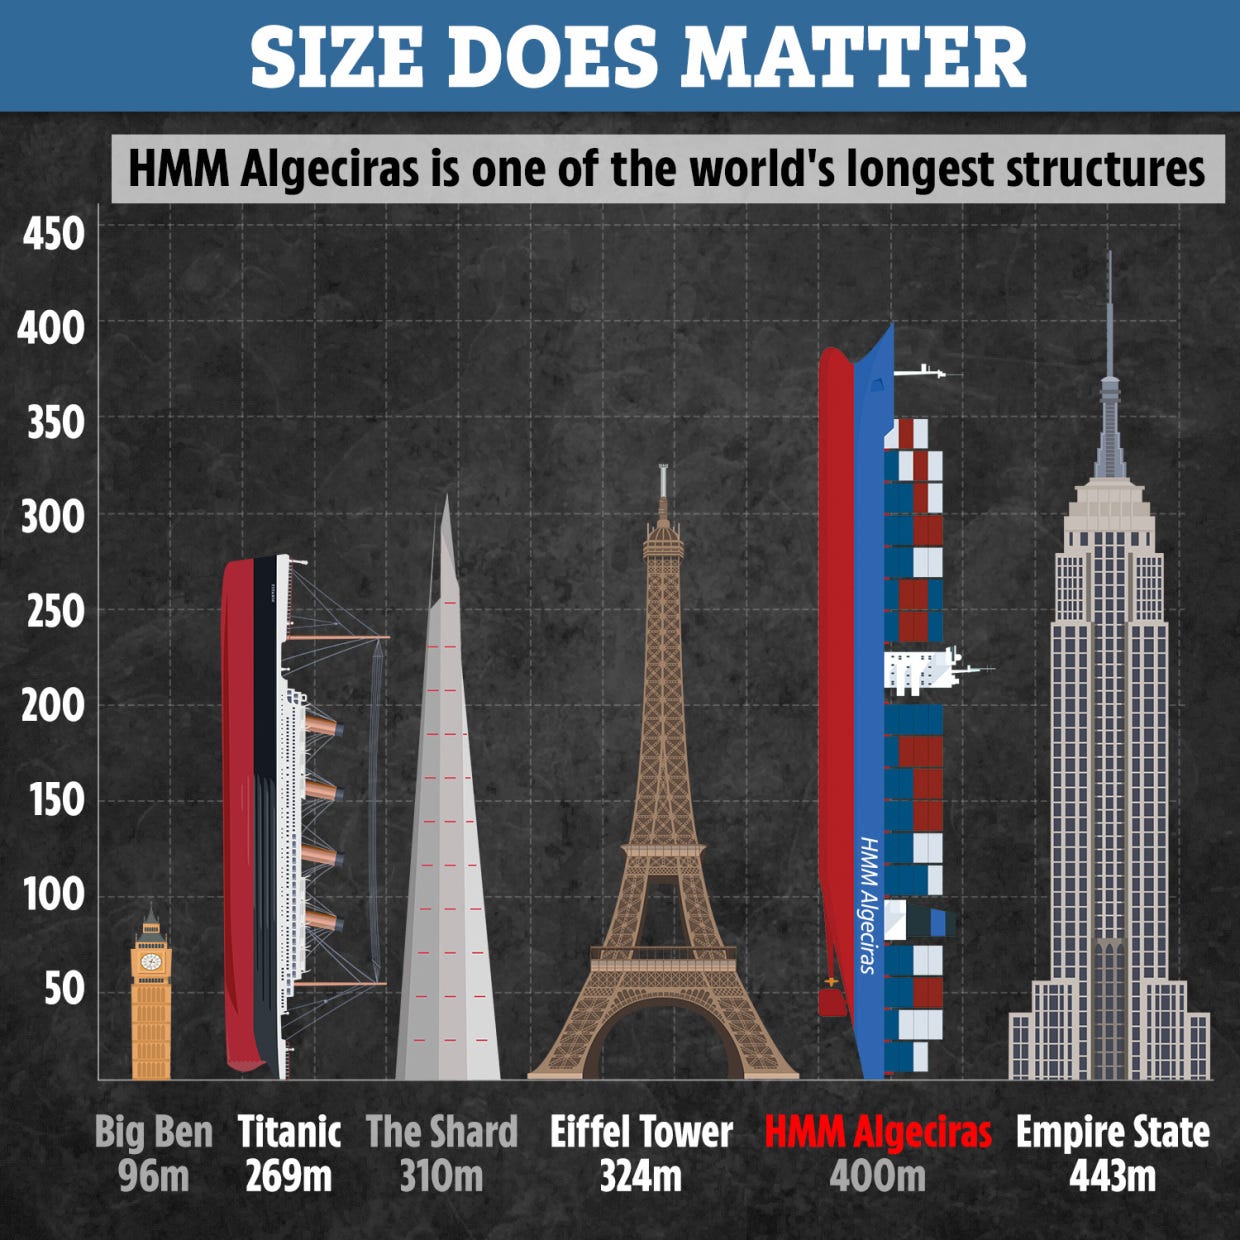
The mega container ship is certainly a sight to behold. The Sun newspaper put together a nice chart that shows that one of the world’s largest container ships is as long as the Empire State Building is tall.
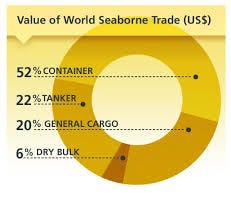
Container ships are not alone, there are plenty of other ships plying the waters, fueling world trade: the oil or gas tanker, the bulk cargo carrier, the automobile carrier, and others. Still, the container ship accounts for the bulk of seaborne trade. This chart below from Lloyd’s Maritime Intelligence gives you the breakdown in terms of the value of seaborne trade.
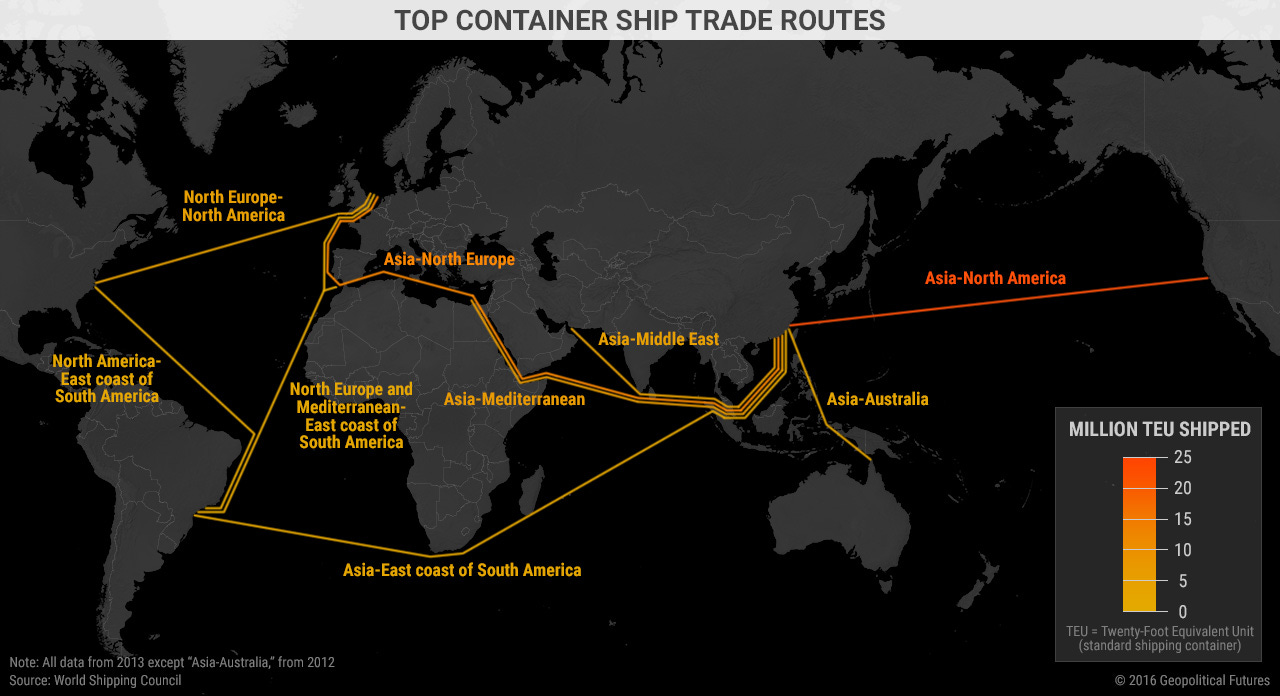
So, what are the busiest shipping routes for these massive structures? No surprise, Asia to North America tops the list. Here’s a nice map from Geopolitical Futures that shows the busiest trade routes. It’s a bit dated, but little has changed since it was published.
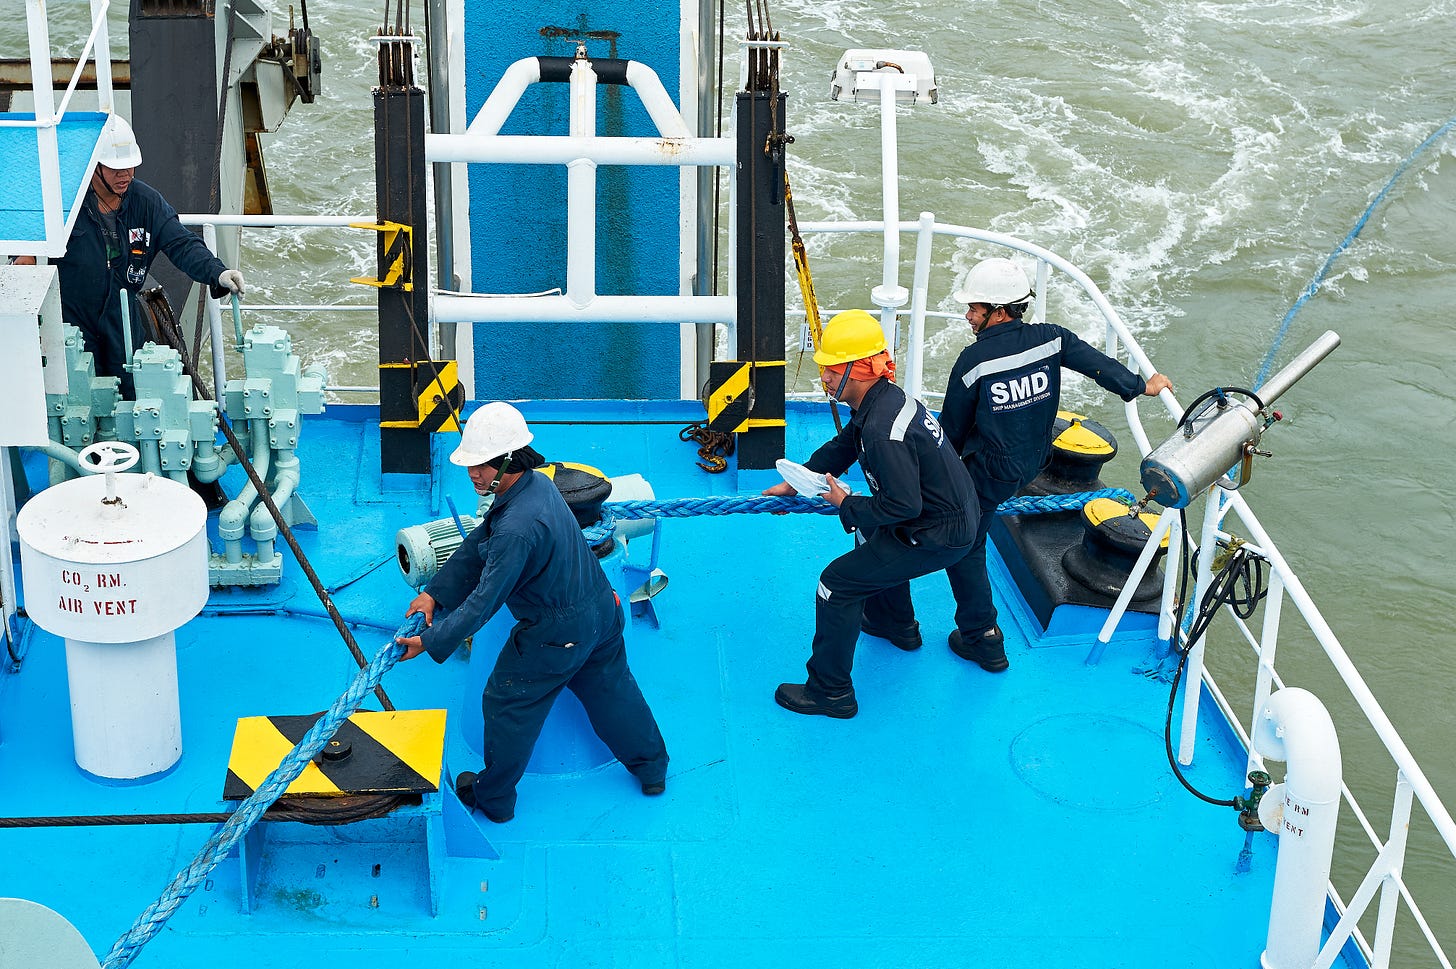
As ports and shipping become more automated, it’s important to remember the men and women (but mostly, overwhelmingly men) who crew these ships. Of particular note: Filipinos, who account for the largest number of skilled crew men worldwide.
According to the International Chamber of Shipping, some 1.7 million seafarers serve on merchant ships worldwide. The five largest supply countries for all seafarers are estimated to be:
China,
Philippines,
Indonesia,
Russian Federation and
Ukraine
Filipinos, however, account for the largest supply of non-officer skilled sea crew, known in industry parlance as “ratings.”
It’s a tough life, made even tougher by Covid, which stranded several hundred thousand seafarers on their boats, unable to disembark. The Washington Post reports:
“Roughly 400,000 seafarers were stranded on ships around the globe at the peak of the ‘crew-change crisis’ in late 2020, according to the International Maritime Organization; now, about 200,000 are stuck. Some have been at sea for as long as 20 months, though 11 months is the maximum time allowed by the ILO Maritime Labour Convention. The situation threatens to grow more dire in the coming months, industry experts say, as mariners desperately try to access coronavirus vaccines, their situation complicated by a web of complex logistics and workplaces often situated thousands of miles offshore.”
“World leaders have called the crew-change crisis a humanitarian emergency. It is also a cautionary tale about essential but oft-ignored global supply chains. Industry officials told The Washington Post there’s been an increase in severe injuries and mental health concerns — including suicide at sea — as mariners have yearned to leave their ships and return home.”
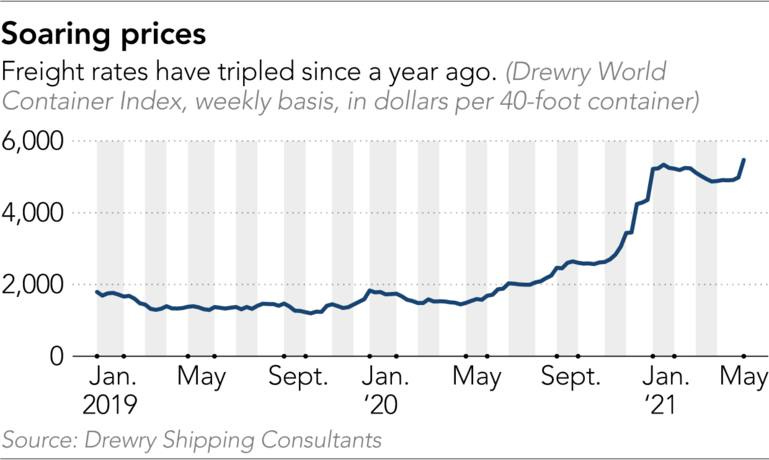
While the major sea ports and trade routes have not changed much in the past decade, freight prices can shift significantly. We’re currently in an upsurge in freight rates fueled by surging demand for just about everything amid vaccine-led recoveries in Europe and North America.
Here’s a chart below from Nikkei Asia Review that demonstrates that the pandemic has actually been good for the shipping business, as rates began to tick upward in the summer of 2020 and today hover at nearly three times pre-pandemic rates.
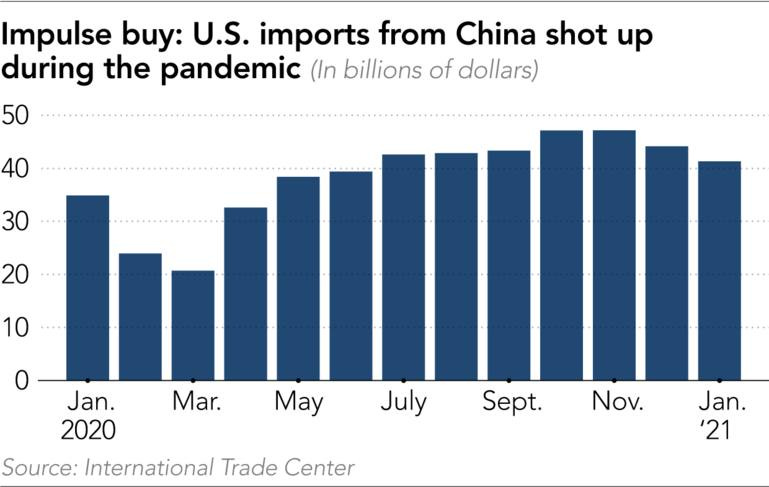
The chart below, also from Nikkei Asian Review, shows that for all of the talk of US-China decoupling and the raft of new measures from the Biden Administration targeting China, US imports from China continue to rise.
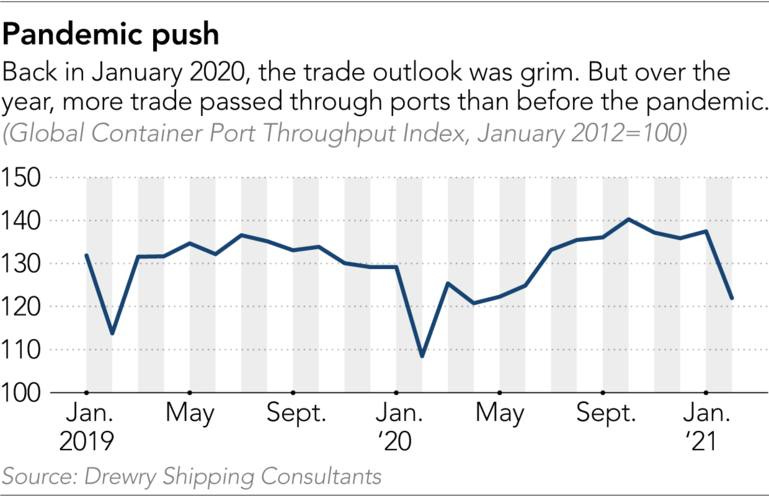
As for the major sea ports, they’ve weathered the pandemic storm and have even thrived, unlike airports. As this Nikkei Asian Review chart shows, more trade passed through ports the before the pandemic.
A few more facts below from the World Shipping Council.
It would require hundreds of freight aircraft, many miles of rail cars, and fleets of trucks to carry the goods that can fit on one large liner ship.
A container of refrigerators can be moved from a factory in Malaysia to Los Angeles -- a journey of roughly 9,000 miles or 14,484 kilometers -- in just 16 days.
Full annual economic impact, including indirect and induced effects of liner shipping: $436 Billion and 13.5 million jobs.
With world trade expected to rise 8% in 2021, these workhorses of globalization will likely continue to be busier than ever.
If you would like to receive regular Emerging markets updates (a daily media round-up), thought leader interviews like the recent one with Daniel Yergin on energy markets and the writing process, the regular Emerging World column, with recent examples like Globalization in a Needle or Globalization in a Mug or Why Travel Matters and more…


